
Data Monitor
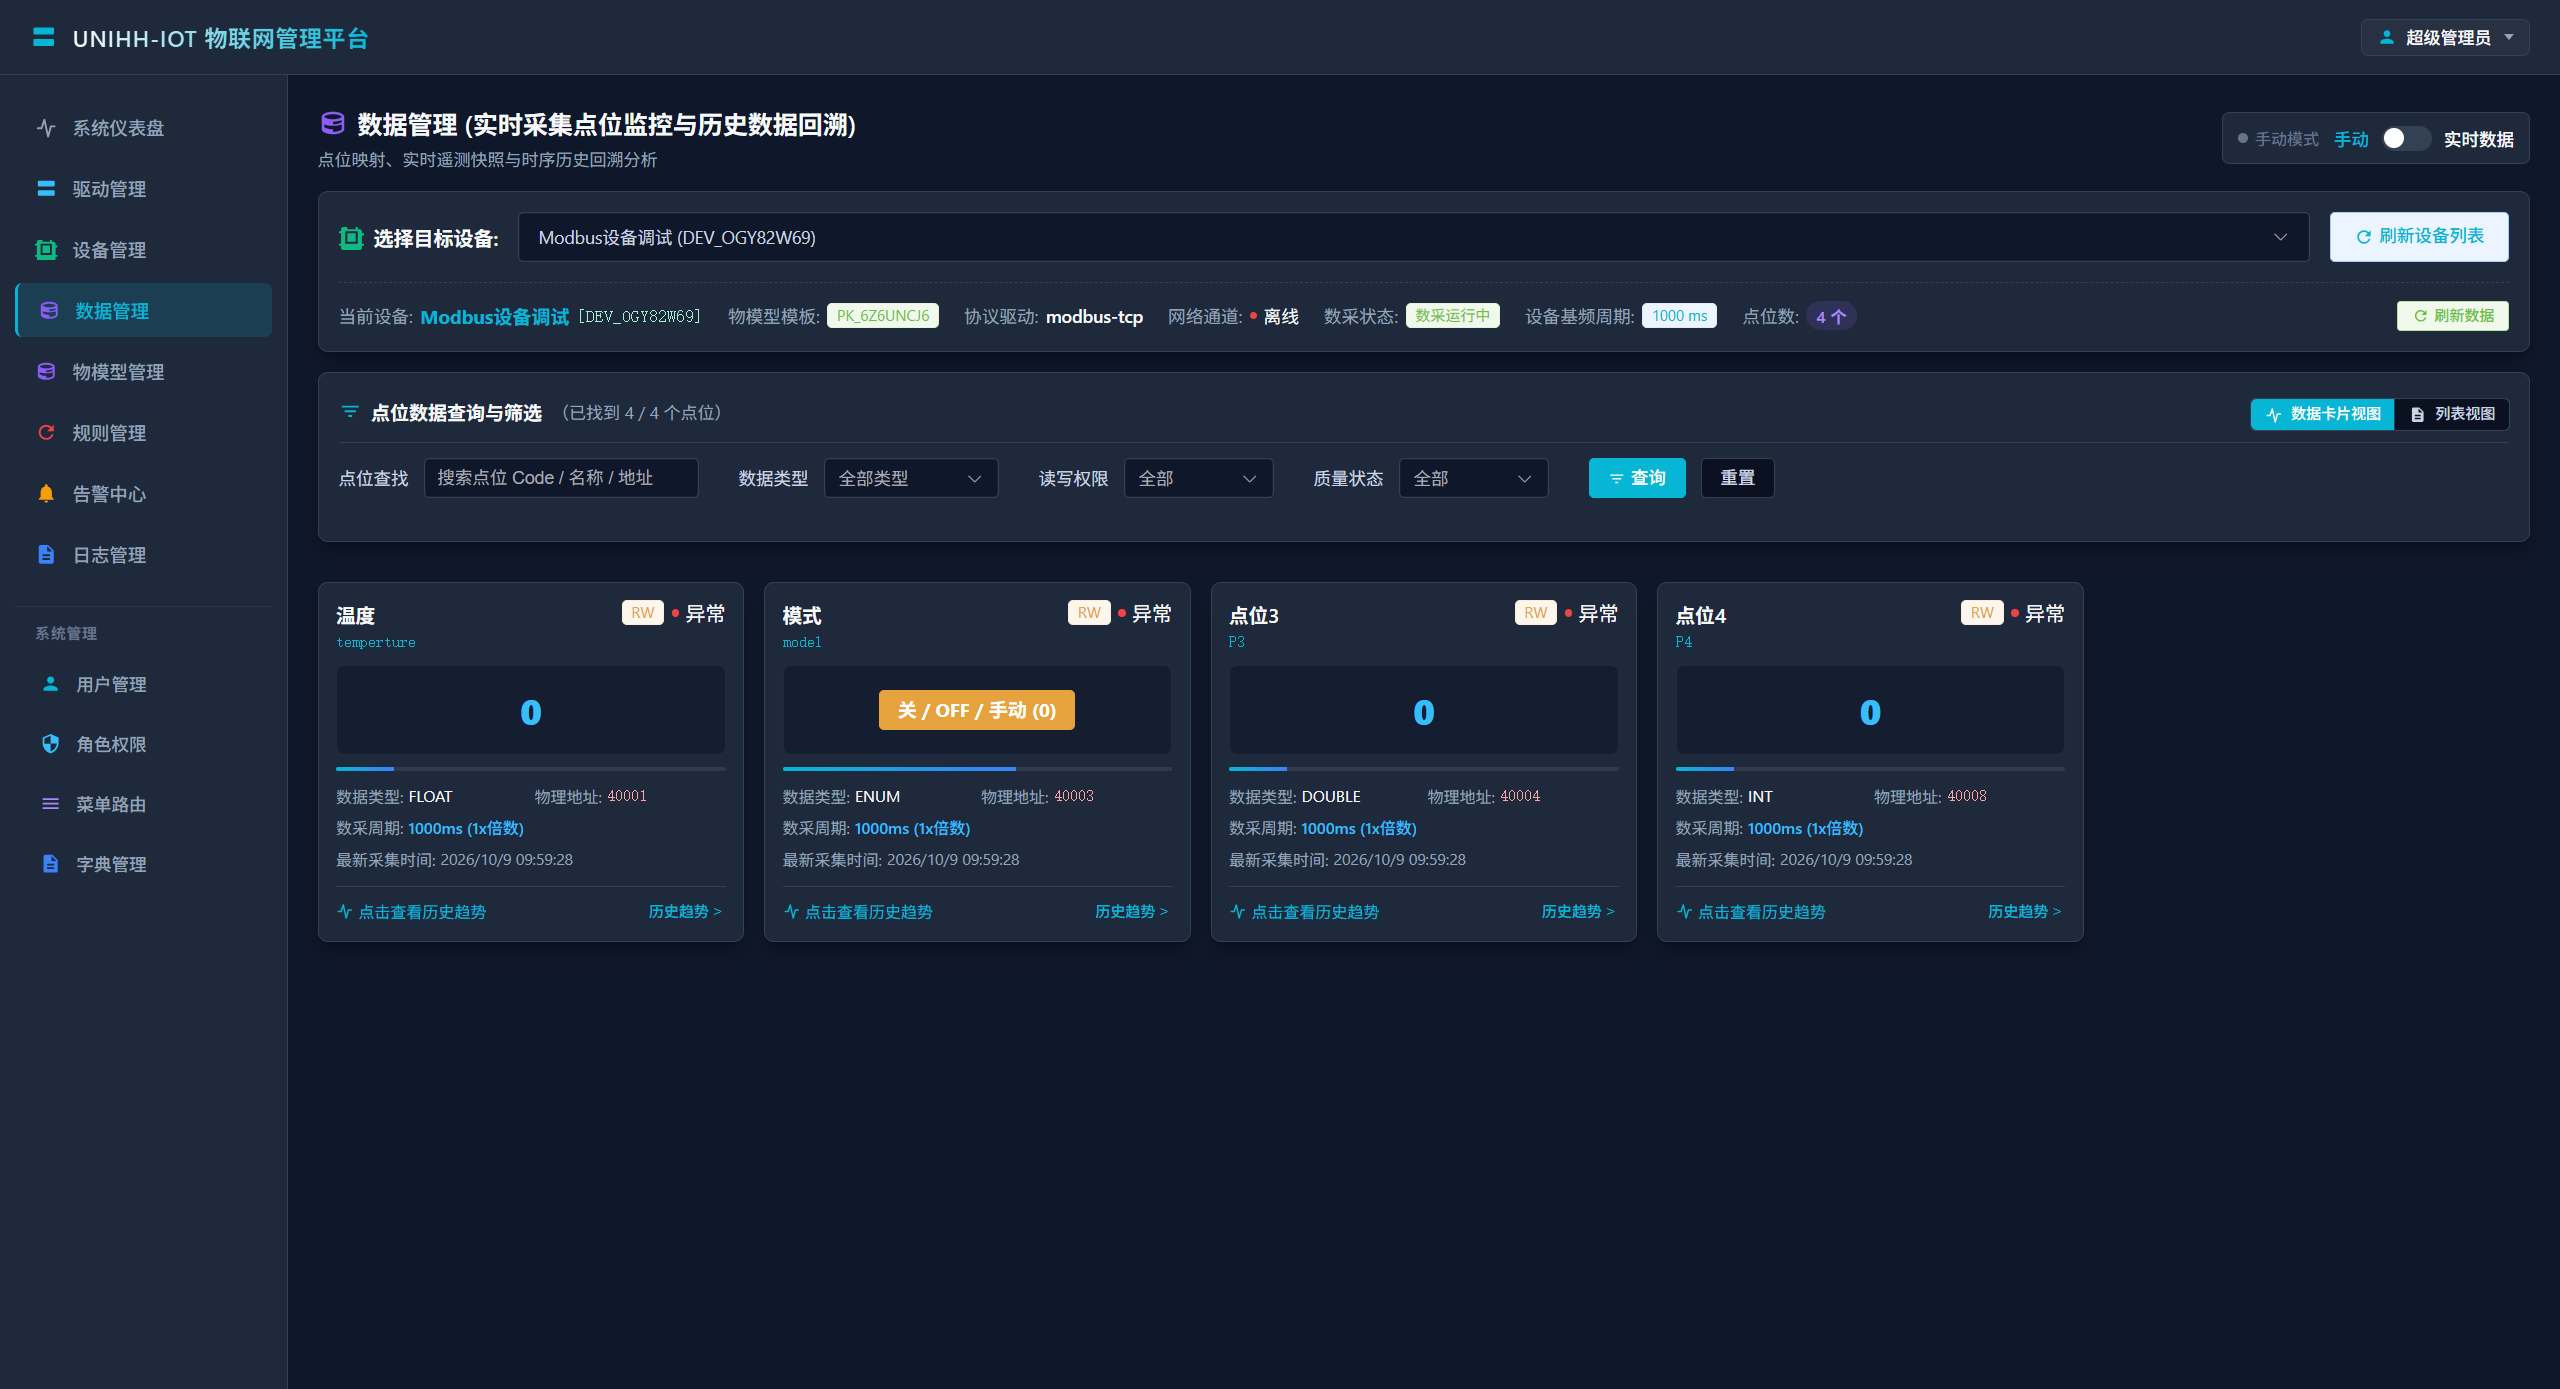
The Data Monitor page shows a single device's points with live values, quality flags and timestamps. It is the go-to tool for commissioning and acceptance testing.
Selecting a Device
The target device dropdown at the top lists every device (name (ID)), with a quick pick row of frequently used devices for fast switching during commissioning.
Once selected, an info bar summarizes the device:
| Field | Meaning |
|---|---|
| Current device | Name and ID |
| Thing model | Bound template |
| Protocol driver | Driver performing acquisition |
| Network channel | Channel identifier |
| Acquisition state | Running / paused |
| Base cycle | Configured acquisition period |
| Point count | Points bound under the current model |
Filtering Points
| Filter | Description |
|---|---|
| Point search | Fuzzy match on code / name / physical address |
| Data type | FLOAT / DOUBLE / INT / BOOL / STRING / ENUM |
| Access | Read-only (R) / read-write (RW) |
| Quality | Normal (Quality=1) / abnormal (Quality=0) |
Reset restores defaults.
Reading Quality Flags
Every value carries a quality marker:
| Quality | Meaning | What to check |
|---|---|---|
| Quality = 1 (good) | Read succeeded and parsed cleanly | — |
| Quality = 0 (bad) | The read or parse failed this cycle | Register address, data type, byte order; device link |
Note
Bad-quality values must not drive decisions. The rule engine validates quality during evaluation, so abnormal values never trigger false alerts.
Commissioning Tips
- After adding a point, check quality before the value: good quality proves the link and address are right; a wrong number points to Scale/Offset or byte order;
- Compare refresh cadence with the base cycle: if updates lag well behind the configured cycle, check EMQX and driver CPU/network load;
- Pair with the driver self-check: when values freeze, run the heartbeat self-check to confirm driver and link state.