
Dashboard
The dashboard is the global status page shown right after sign-in. It stacks a row of stat cards above two charts, fed live from the admin center's Dashboard API through the gateway.
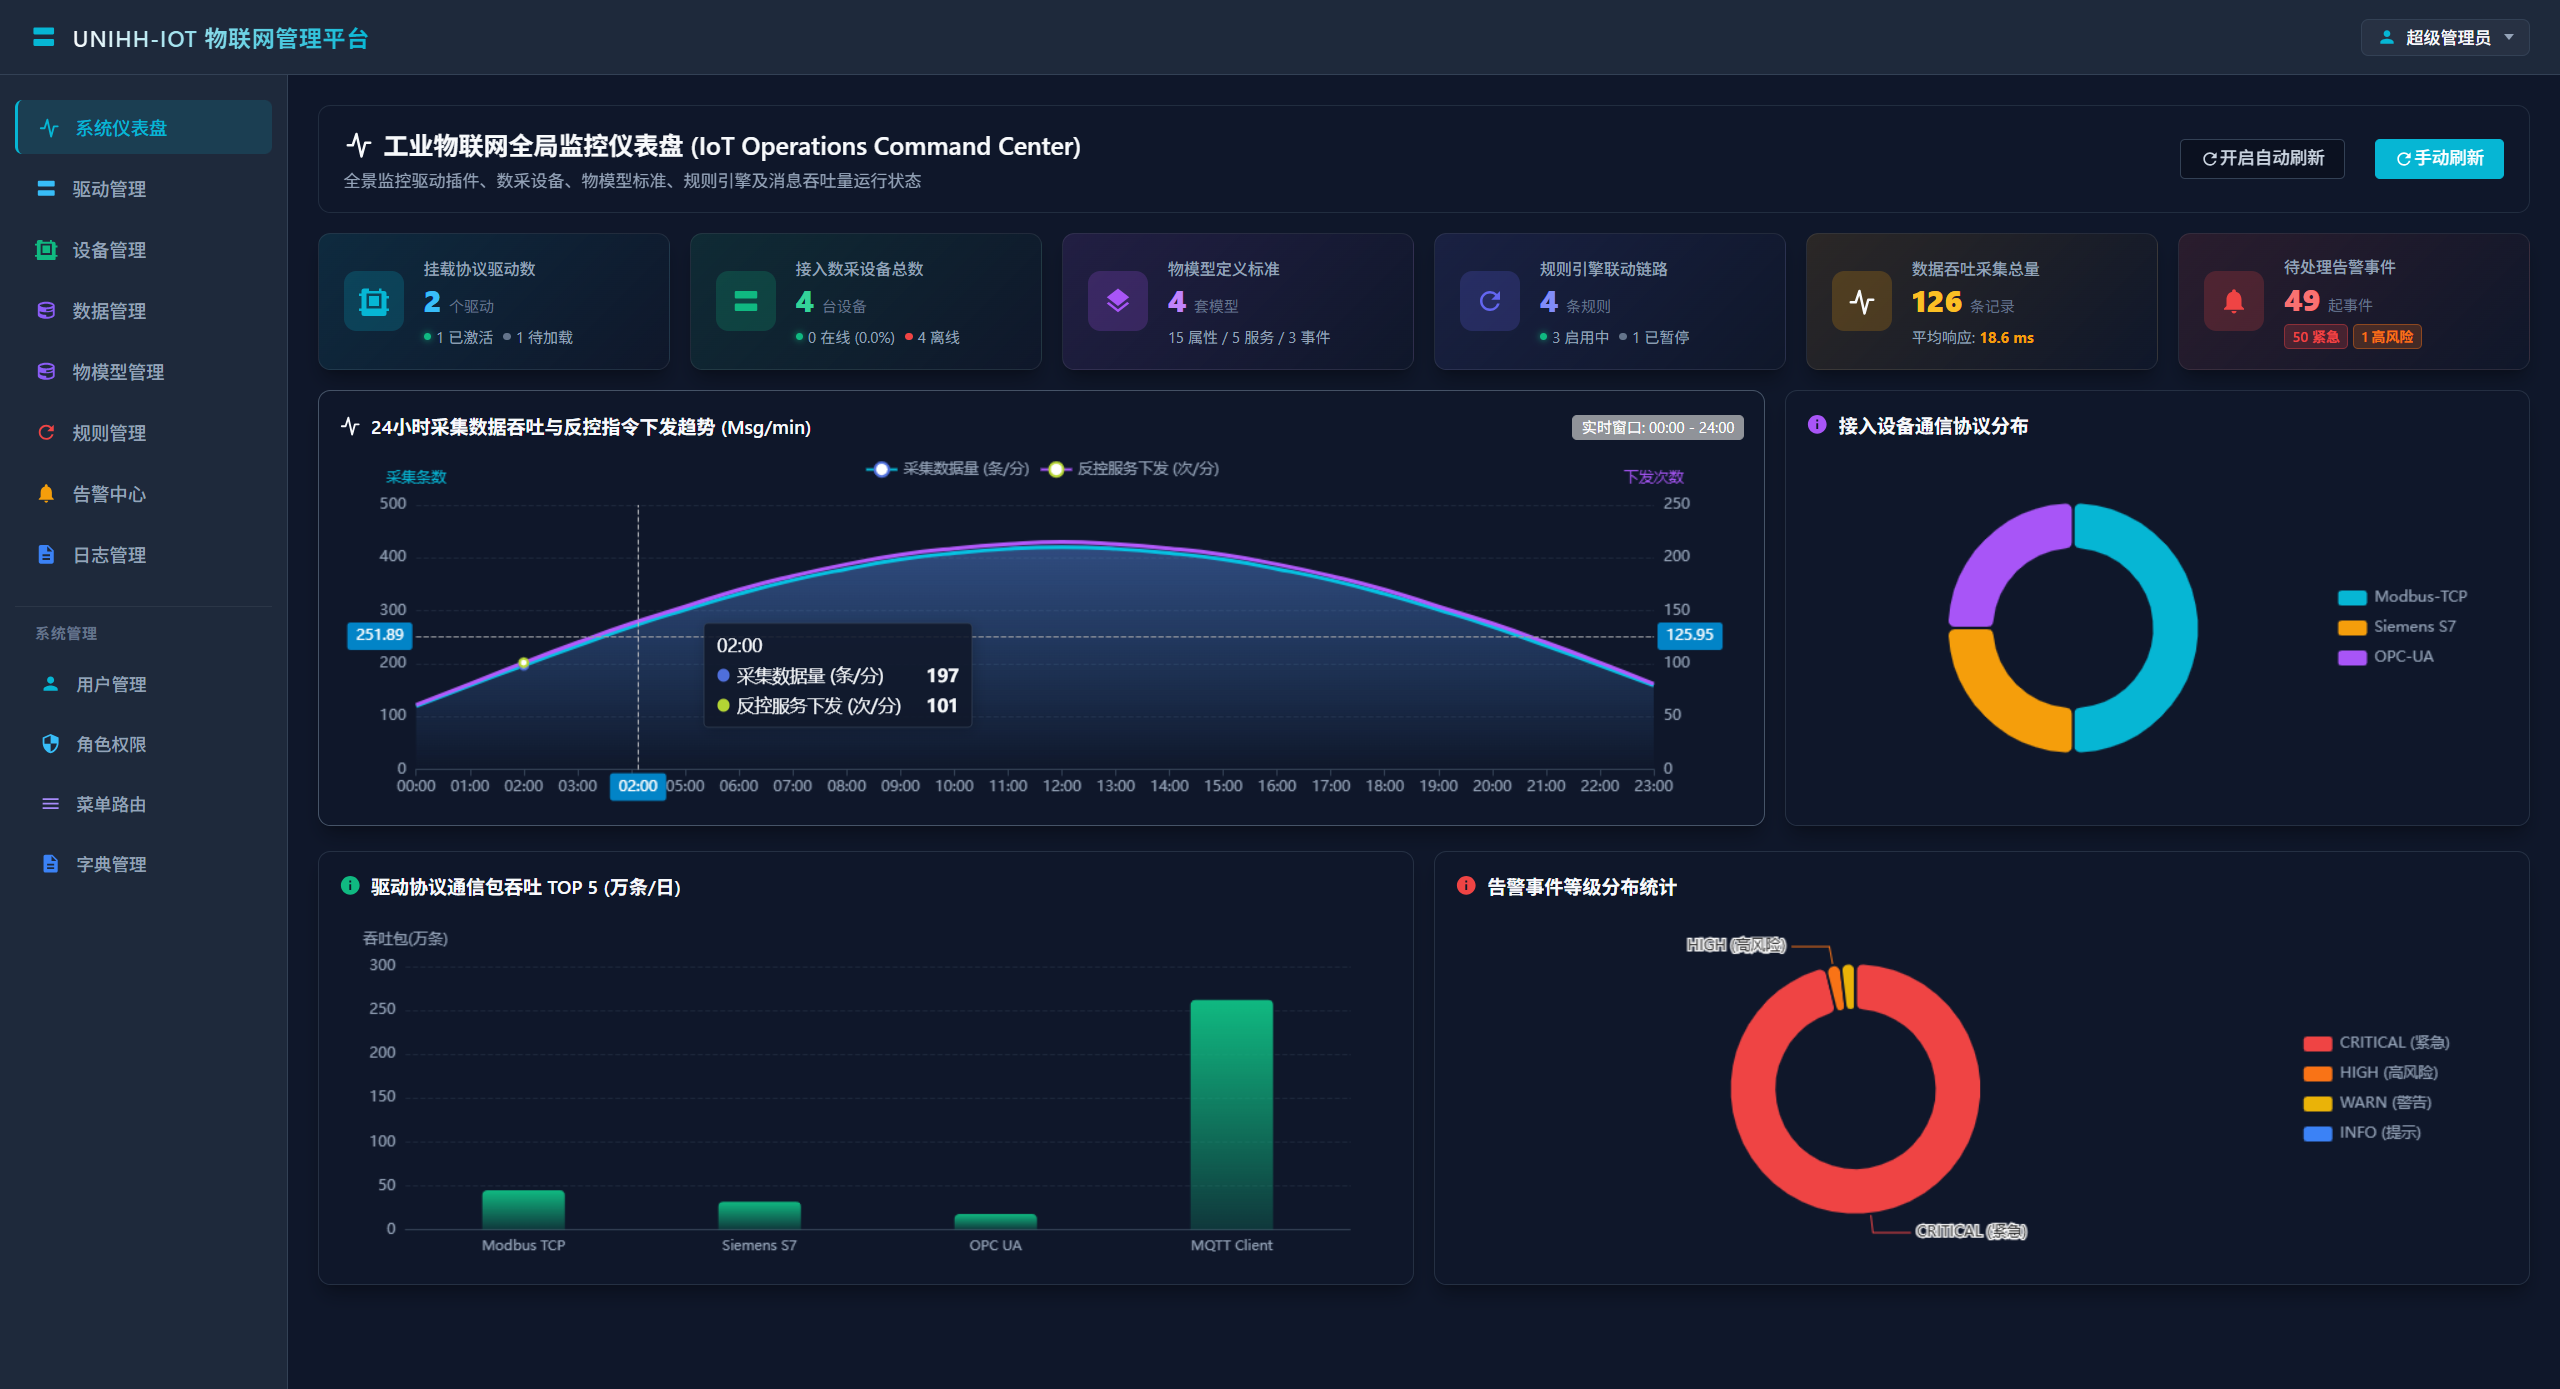
Stat Cards
| Card | Meaning |
|---|---|
| Mounted protocol drivers | Registered drivers and how many are online |
| Connected devices | Total devices in the registry |
| Thing model standards | Created thing model templates |
| Rule engine chains | Configured rules |
| Acquisition throughput | Total records collected and average response time |
| Pending alarms | Events in the unhandled state |
When a number looks wrong:
- Drivers at 0 → run a heartbeat self-check on Driver Management;
- Devices at 0 → confirm devices exist on Device Management;
- Pending alarms rising → work the queue in the Alarm Center.
Charts
- Devices by protocol: device share per driver type — a quick audit of acquisition scale;
- Alerts by severity: distribution across CRITICAL / HIGH / WARN / INFO, useful for judging field health.
Tips
- The dashboard works well as a shop-floor wall display and as the first stop of a daily inspection;
- A steadily rising average response time usually points to pressure on EMQX or the storage engine — see Deployment for tuning guidance.