
Alarm Center
When a rule fires or a thing-model event triggers, an alarm event is created. The Alarm Center is where events are reviewed, acknowledged and dispositioned for the record.
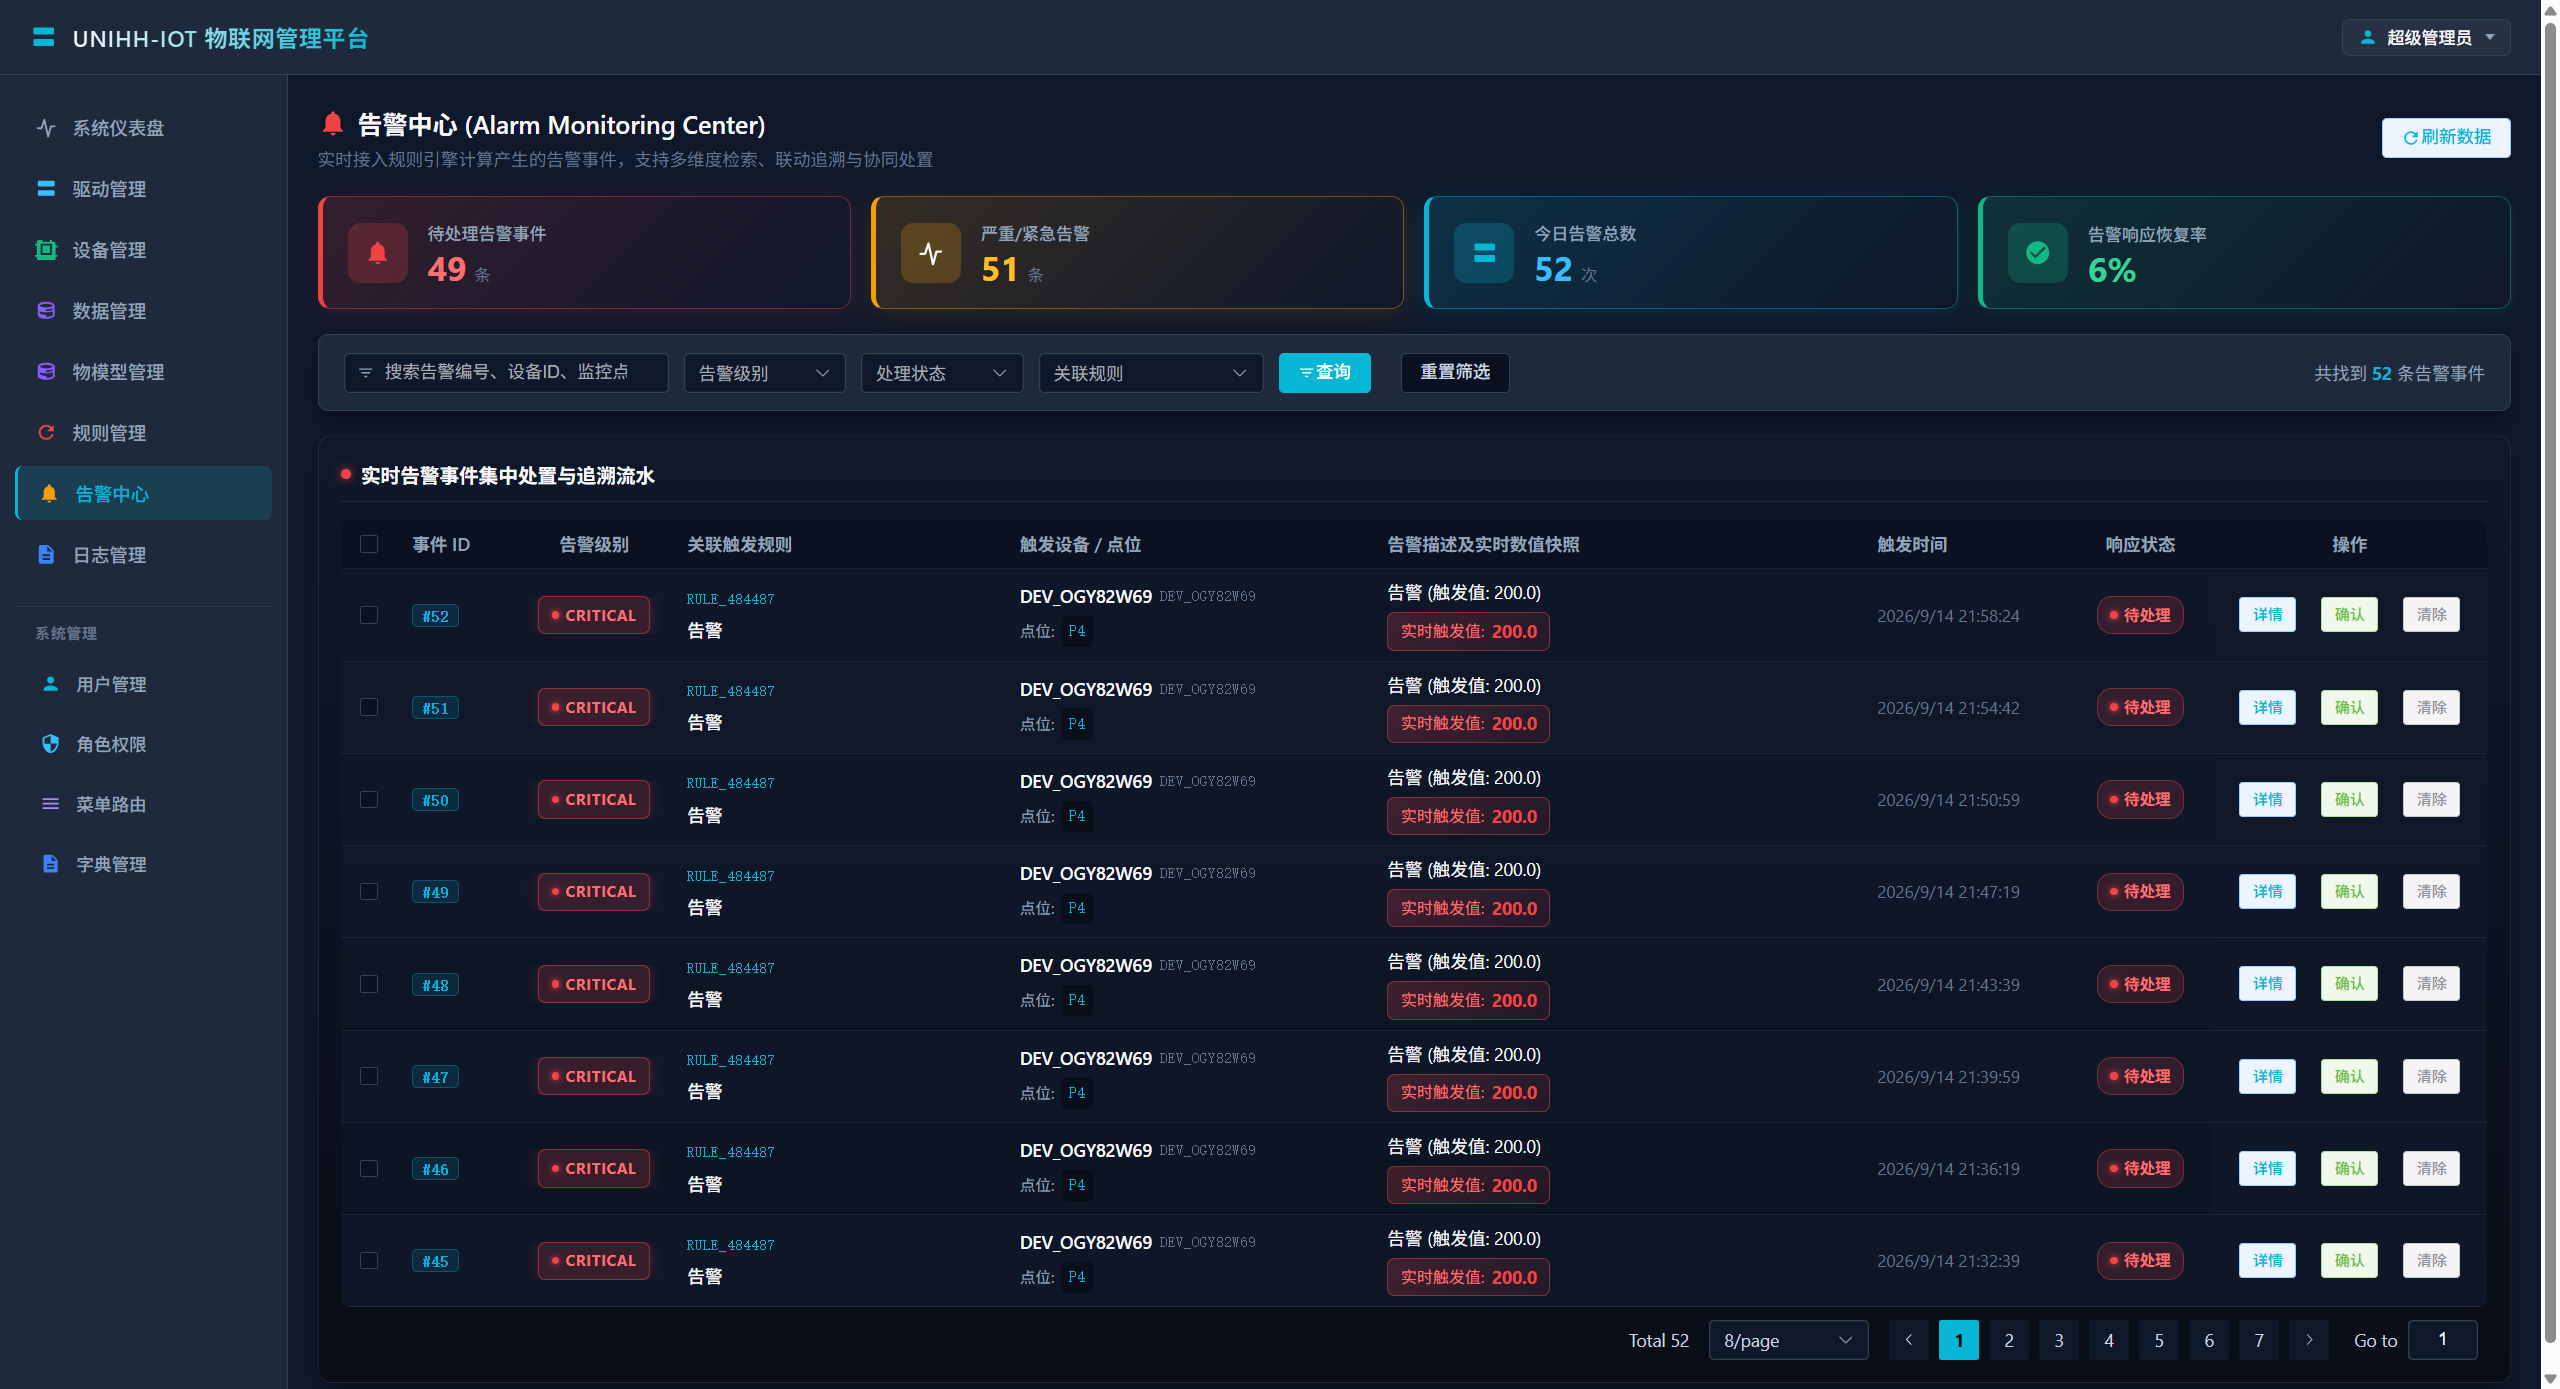
Status Cards
| Card | Meaning |
|---|---|
| Pending alarms | Events in the unhandled state — watch these |
| Alarms today | Total events raised today |
| Response / recovery rate | Share of recovered events — a proxy for how well anomalies get resolved |
Finding Events
| Filter | Description |
|---|---|
| Keyword | Fuzzy match on event number, device ID, point or message |
| Severity | CRITICAL / HIGH / WARN / INFO |
| State | Unhandled (0) / Acknowledged (1) / Recovered (2) |
| Rule | Filter by the triggering rule |
Event List
| Column | Description |
|---|---|
| Event ID | Unique number |
| Severity | Four-level color coding |
| Triggering rule | The rule that raised the event |
| Device / point | Where it happened |
| Description and live value snapshot | The point's value at trigger time — the direct evidence of magnitude |
| Triggered at | Event timestamp |
| State | Unhandled / acknowledged / recovered |
Disposition Workflow
- Acknowledge: once the anomaly is verified on site or remotely, mark it acknowledged to stop duplicate notifications;
- Disposition: in the detail dialog, record the cause, the field investigation and the resolution in the disposition notes — this forms the audit trail;
- Recover: events auto-flip to recovered when the point returns to range; operators can also close them manually.
Tip
The notes are where experience compounds. Record at least cause and action taken so the next occurrence is a five-minute fix instead of an hour.
How It Connects
- Events originate from Rule Engine conditions or thing-model events; adjust thresholds in the rule config;
- The recorded trigger value can be cross-checked against snapshots on Data Monitor;
- The dashboard's pending alarms card matches this page's unhandled count — a natural shift-handover metric.